Market Profile is best understood as a way to see order in the markets.
While not a typical “indicator.” Market Profile takes the data from each day’s trading session and organizes it to help us understand who is in control of the market and what is perceived as fair value.
Market profile is more similar to the Market Internals (market breadth and advance/decline line) than a moving average or stochastic indicator.
Developed by J. Peter Steidlmayer in the 1980s, Market Profile was a way for traders to get a better understanding of what was going on, without having to be on the trading floor.
We typically see market data organized by time, price and volume. Market Profile organizes the data in such a way that makes more sense of where prices traded throughout the day.
How it Works
Each day the market will develop a range for the day along with a value area. This value area represents an equilibrium point between buyers and sellers. The “profile” follows a normal distribution curve.
Volume is the key ingredient to understanding Market profile. If prices move away from their equilibrium (value area) and volume starts to dry up, it is likely that prices will move back into value.
If price moves away from equilibrium on strong volume, this is a sign that traders are reevaluating the current value area as there has been a shift in sentiment.
Breaking Down the Profile
Market Profile is made up of TPO’s (Time Price Opportunities). A different letter is assigned to each 30-min time period of every trading session. I like to begin with A, but you will see varying charts start with different letters.
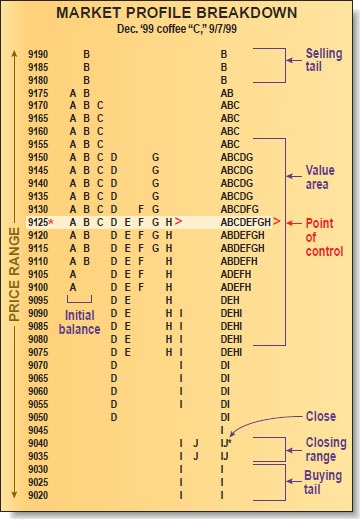 The POC (Point of Control) is the row at which the most number of TPO’s occurred.
A value area is calculated using 70% of the days TPOs to give us a value area high and a value area low. This value area is used as a reference in the following day’s trading session.
Calculating Value
Let’s look at how we calculate value area using the TPO count.
- Count the total number of TPOs in a single day’s profile.
- Calculate 70% of this number.
- Identify the Point of Control (POC), the longest line of TPOs closest to the center of the profile. Note it’s TPO count.
- Add the TPOs of the two prices above and below the POC.
- Beginning with the larger number of combined two rows of TPOs, add this number to the POC number, continuing this process until the number reaches 70% of the total TPOs for the day (the resulting number from step 2).
Example:
- Total TPOs = 131
- 70% of 131 = 92
- TPOs at POC = 11
- TPO Count = 11 + 20 + 18 + 16 + 14 + 9 + 6 = 94
- Value Area Low = $2148
- Value Area High = 2158
Using Market Profile
As I talk about a lot on the EminiMind blog, it’s the first 60-mins of trading sets the tone of the day and gives us an upper and lower price range to use as a reference point for the day. In market profile this first hours range is known as the initial balance.
A wide initial balance (or opening range) suggests that prices will stay within that range and we will most likely chop around from the lower end to the upper end of the range, back and forth all day.
When prices go above or below the initial range, this is known as a range extension often seen exaggerated on trend days.
Sometimes, price will only stay at a given price level for one TPO print, this is known as a single print buying/selling tail.
Identifying the Different Types of Days
- Normal Day – a wide initial balance and a relatively balanced market
- Normal Variation of a Normal Day (Most Common) – Most activity occurs during the initial balance with a small range extension, usually depicted as nice smooth bell curve.
- Trend Day – Prices are constantly moving in one direction. On a trend day we typically see 5 or less TPOs per row.
- Double-Distribution Day – Typically a double-distribution day starts out as a trend day and forms a second balance or equilibrium area.
- Non-Trend Day – A narrow trading range, with a wide profile, usually little or no range extension.
- Neutral Day – A symmetrical profile with an open and close near the POC


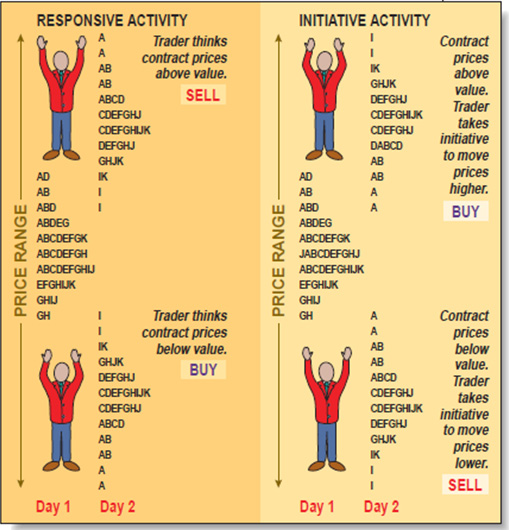
Buying and Selling with Market Profile
When we look at Market Profile, we want to compare the developing profile (today’s price action) to that of the prior day’s profile.
You can likely spot a trend forming, by looking at the movement of the value area. If the POC and value area are moving in the same direction day after day, it is a clear sign that we are trending. When the POC begins to move sideways, line up with the previous POC or we trade mostly within the prior day’s value area it is a sign that the trend is either changing, or that no trend exists and we’re moving sideways.
When we open above value and volume is strong (or increasing) that tells us that higher prices are being accepted. When we open above value and volume is weak, that’s a sign we will likely fall back down into value.
The same is true for opening below value. Strong volume indicates prices being accepted, light volume is a sign that we won’t be spending much time at that level.
Market Profile Definitions
- Time Price Opportunity (TPO) – The letters assigned to each 30-min time period.
- Initial Balance – The first hours range.
- Value Area – Where 70% of the day’s trading took place.
- Value Area High (VAH) – The upper level of value area.
- Value Area Low (VAL) – The lower level of value area.
- Point of Control (POC) – Price where the most trading occurred (longest line of TPOs).
- Single Print Buying/Selling Tail – When price makes a one letter print in a row.
- Range – The high to low of a day’s price action
- Range Extension – An extension of price beyond the initial balance.
Links and Resources from this Article
In creating The Ultimate Guide to Market Profile I utilized graphics from this Market Profile Basics article.
Summary – How Market Profile Can Help You in Your Trading
Market Profile is a way to simplify the market price action and determine the area which traders found to be fair value.
While the Market Profile is not an entry and exit method in itself, we can use it as a gauge of market sentiment to determine what levels are likely to see lots of action, and to identify early on what type of day is forming.


Great presentation. I use Market Profile every day my trading. It helps me make sense of what is going on, and sometimes nothing the market does makes sense.
Thanks Tim for explaining this even more.
You’re welcome Steve!
Sierra Charts (included w/ Infinity) now comes with Market Profile if you don’t wish to calculate it yourself. Here’s the link: Infinity Market Profile
Sierra also has a study called “TPO Value Area Lines” which can be very handy in just seeing where price is likely to bounce, instead of having to analyze a market profile chart. Price tends to rotate around TPO POC, so shorting just below TPO VAH or going long just above TPO VAL can give some really good trades with pretty tight stops.
Hi! Best resource I’ve seen on MP! Well done. I’m still looking for an explanation of what I can expect from various measured moves. I see people tweet about targets obtained from things like: look above/below and fail, returning to the half-back, spikes, re-testing the bottom/top of single-prints, a lack of excess, poor highs/lows, re-testing the prior week’s high/low (or the OVN ones), or most importantly – getting a typical measured move from seeing prices leave a range, not return inside it, and then travel to a target equal to the size of the range left behind.
All of these are important insights to be aware of and/or inform trading. Where can I find a resource for them, if not here?
Thank you!
Hey thanks Mark, I’d say the best resource for Market Profile is Jim Dalton. Peter Reznichek (Shadowtrader) shares a lot of MP insights as well.
I agree….. I just wanted the Reader’s Digest version of his books! Thanks!
It’s been my experience that there are a lot of subtleties to MP (and trading in general). The two most important pieces being able to identify balance areas (wide TPOs) and trending areas (narrow TPOs). Where there is a lot of overlap, more resistance lies, where there is not much overlap and very few TPOs, better chance of fast running trend.
Do you know where I can either download the TPO data for a specific ticker on a specific day or what I would use to calculate it on my own? I have downloaded 1 minute candles and while I have come pretty close to calculating the data for most days there are days where my calculations are off, and I am not able to see why it is failing.
This is a really good description of how to track TPO information. Great article!
Thanks Stacey. The way I do it when using excel is to pull up a 30-min chart and simply add in the letters myself by looking at the high and low price for the first 30-min bar and going forward from there. Thinkorswim does have their own version of Market Profile called Monkey Bars.
TD is what I am using as well. For both the data as well as the monkeybars values I am using as the baseline. I switched to a 30 minute candles and they are slightly off as well. Just curious if you know of a way to download the TPO value data or how to calculate it from candle data.
Thank you for your rapid reply. Clearly I am hitting the send button before I am finishing.
I don’t other than just looking at the high and low price of the candle and filling in the letters right in excel. You may try Thinkscripter or another TOS specific coder. They might have an option for that.